

June 10-16 saw the second tranche of Bridgerton season 3, and the show is back on top of the weekly Top 10 views. Rather expected, but I note the audience views looks low — only 28,000,000 views, compared to around 45,000,000 for the first tranche. But. This now looks across eight episodes, not four, so it’s actually comparable and possibly better. Certainly more hours.
But I’m confused (and figured out why)
I’ve been tracking the total views for season 3 to see when it will enter the all time top 10 (after 91 days). Here’s my adding up (confused version):
| Week | VIews |
|---|---|
| 1 | 45,100,000 |
| 2 | 25,300,000 |
| 3 | 11,600,000 |
| 4 | 6,900,000 |
| 5 | 28,000,000 |
Adding these up gives (approximately) 117,000,000 views! Now look at the all time Top 10 after 91 days:
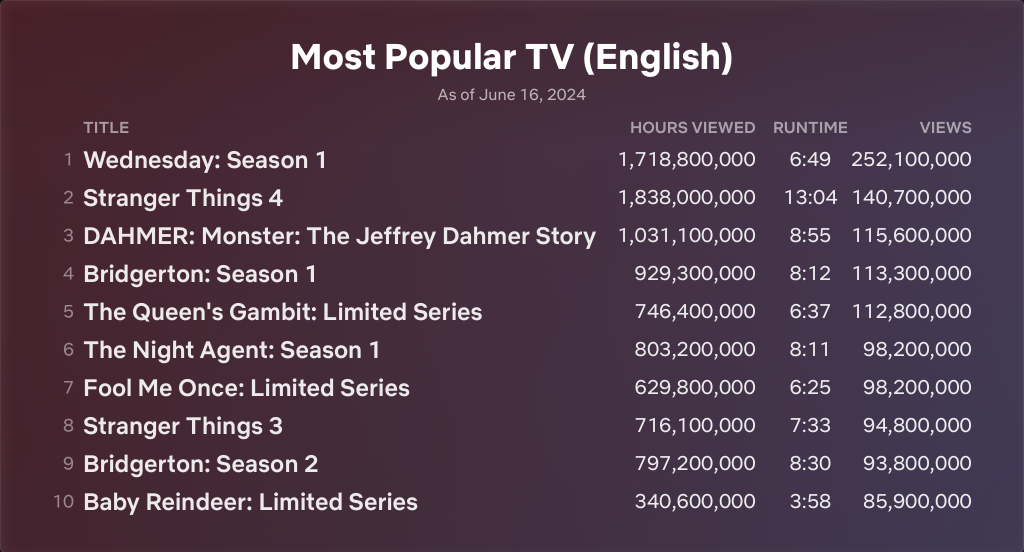
On a first glance, Bridgerton season 3 should be #3. In fact, it should have been #10 last week. Where’s the mistake? Well, it’s compared apples and half-apples. The first four weeks while only shown as being over four episodes, the all time must be looking at the full run. The first few weeks need to be (roughly) halved!
Here’s how it should look:
| WEEK | VIEWS (Half Season) | VIEWS (Season) |
|---|---|---|
| 1 | 45,100,000 | 22,550,000 |
| 2 | 25,300,000 | 12,650,000 |
| 3 | 11,600,000 | 5,800,000 |
| 4 | 6,900,000 | 3,450,000 |
| 5 | N/A | 28,000,000 |
Now my five weeks total is around 72 million, maybe a little more. I now predict Bridgerton season 3 will almost certainly make the Top 10 of all time in two weeks time, and might achieve this next week. I’m now predicting a 91-days total in the mid 90 millions, probably above season 2, not season 1. The size of next week’s audience will give a strong indication.
